*
It is currently Mon Nov 10, 2025 10:25 am

All times are UTC - 6 hours


Post new topic Reply to topic  [ 582 posts ]  Go to page Previous  1 ... 30, 31, 32, 33, 34, 35, 36 ... 59  Next
Author Message
 Post subject: Re: Bob's Weekly Progress
PostPosted: Mon Jul 27, 2009 11:53 am 
Offline

Joined: Tue Jun 02, 2009 11:14 am
Posts: 317
here is a little trick that I use

lets say you keep your week numbers in column A and your total units in column B. Then create a new column C, where C=B+0.001 (or some very small number)

You want to plot column A against column C (not column B). It'll look almost identical, but the subtle change is required for the next step

You want to add a trendline (right-click on one of the points on your graph and click "Add trendline"). When the dialog box comes up asking what type, you want to select "exponential". Then move from the type tab to the options tab on the dialog box. Where it says "Set intercept" put a number in the box equal to your pre-sinclair numbers - e.g. Bob would use 50 here.

This is the correct form of the extinction curve as per Sinclairs original research.

A further little trick, if you're up for it, is to use your daily figures rather than weekly (more scatter, but more data is beneficial here) and on the "options" tab to forecast forward 200 periods (if using daily) or 30 periods (if using weekly). Now if you calculate your target consumption at the end of the program (say 15 units per week), you can get an estimate of how long the method will take for you.

A word of warning though - don't read too much into the curve until you have a reasonable amount of data - probably at least 7-8 weeks, or more if you have much variation in your drinking patterns

_________________
Pre-TSM, ~105 (UK) Units, ~0.5 AF days, Craving 8
Wk 1-8 93/0.25/3.5
Wk 9-16 79.5/0.5/2.8
Wk 17-24 75/1.2/2.7
Wk 25-32 61.5/2.3/1.6
Wk 33-40 47/3.5/1.1
Wk 41-48 47/3.5/1
Wk 49-56 44/3.8/1
Wk 57-64 45/3.8/1
Wk 66 45/3/1
Wk 66 65/1/1
Wk 67 48/3/1


Top
 Profile E-mail  
 
 Post subject: Re: Bob's Weekly Progress
PostPosted: Mon Jul 27, 2009 11:58 am 
Offline

Joined: Thu Feb 05, 2009 2:07 pm
Posts: 929
Two cents from someone who won't even post her numbers in her sig line, let alone graph them:

The trend line (polynomials) is the truly significant expression of the data. (I was forced to learn to interpret polling data in a past life). Actually, this is a big reason why I don't like to look at my numbers every day. I love reading the graphs of others but don't have the time or energy do graph my own. Raw numbers can be misleading. Remember, mabelee graphed the #'s of houtx and identified progress where the raw numbers didn't show it. So I think it's really valuable when Bob and others graph teir data, especially the trend line.


Top
 Profile E-mail  
 
 Post subject: Re: Bob's Weekly Progress
PostPosted: Mon Jul 27, 2009 12:10 pm 
Offline

Joined: Tue Jun 02, 2009 11:14 am
Posts: 317
lena wrote:
The trend line (polynomials) is the truly significant expression of the data. (I was forced to learn to interpret polling data in a past life).


Sorry Lena - but I don't agree. You have to ask about the nature of the relationship - i.e. how does the sinclair method reduce units over time, and what form does that reduction take. You cannot reduce your units below zero (although Jesus at Cana might mount a credible argument about negative consumption rate :lol: ), so any relationship must approach zero over time (if the method is working), but never cross zero - i.e. the relationship is asymptotic (to use the mathematical term). There are only two realistic candidate curve families that show this trend a (negative) power curve, or a (negative) exponential. An exponential curve is appropriate here, because the slope of the curve (i.e. how your consumption is decreasing) is proportional to the value of the curve (i.e. the amount you're drinking at a particular time).

PS. None of the above is intended as any kind of personal attack on your :D Just the whole area of spurious graphs is a bugbear of mine - the business and social sciences seem to be full of morons who incorrectly teach this stuff to their students.

_________________
Pre-TSM, ~105 (UK) Units, ~0.5 AF days, Craving 8
Wk 1-8 93/0.25/3.5
Wk 9-16 79.5/0.5/2.8
Wk 17-24 75/1.2/2.7
Wk 25-32 61.5/2.3/1.6
Wk 33-40 47/3.5/1.1
Wk 41-48 47/3.5/1
Wk 49-56 44/3.8/1
Wk 57-64 45/3.8/1
Wk 66 45/3/1
Wk 66 65/1/1
Wk 67 48/3/1


Top
 Profile E-mail  
 
 Post subject: Re: Bob's Weekly Progress
PostPosted: Mon Jul 27, 2009 2:31 pm 
Offline
User avatar

Joined: Wed Apr 22, 2009 11:50 am
Posts: 246
bob3d wrote:
Image


really sweet graph bob!
I am used to daily look at charts - and your graph tells me ... down-down-down
if you were an instrument traded on stock market I would "short sell" you to profit from your downmovement (in units) :-)

_________________
New Progress Thread :
http://www.mywayout.org/community/f9/craving-nal-start-23-apr-2009-bac-start-08-jan-2010-a-39824-new-post.html


Top
 Profile  
 
 Post subject: Re: Bob's Weekly Progress
PostPosted: Mon Jul 27, 2009 2:58 pm 
Offline
User avatar

Joined: Mon Jun 29, 2009 9:23 am
Posts: 261
Location: Oregon, USA
Enjoying discussion about the graphs. I was thinking of using a 7-day rolling average to smooth out the daily ups and downs. But using whatever method was used in the study data makes sense.

I'm not sure I fully understand what the .001 offset does.

_________________
The Sinclair Method worked for me - week by week, month by month.
One step to sobriety; my higher power was science.


Top
 Profile E-mail  
 
 Post subject: Re: Bob's Weekly Progress
PostPosted: Mon Jul 27, 2009 3:10 pm 
Offline
User avatar

Joined: Wed Apr 22, 2009 11:50 am
Posts: 246
PlainVanilla wrote:
Enjoying discussion about the graphs. I was thinking of using a 7-day rolling average to smooth out the daily ups and downs. But using whatever method was used in the study data makes sense.

I'm not sure I fully understand what the .001 offset does.


I really love the 5x50 cross of Moving Averages. But 10x20 might be better in our sence - especially as it is quite hard to get a 5x50 cross on MA's on the amount of data we have!

_________________
New Progress Thread :
http://www.mywayout.org/community/f9/craving-nal-start-23-apr-2009-bac-start-08-jan-2010-a-39824-new-post.html


Top
 Profile  
 
 Post subject: Re: Bob's Weekly Progress
PostPosted: Mon Jul 27, 2009 3:55 pm 
Offline
User avatar

Joined: Sun Mar 15, 2009 7:40 pm
Posts: 962
Location: Florida
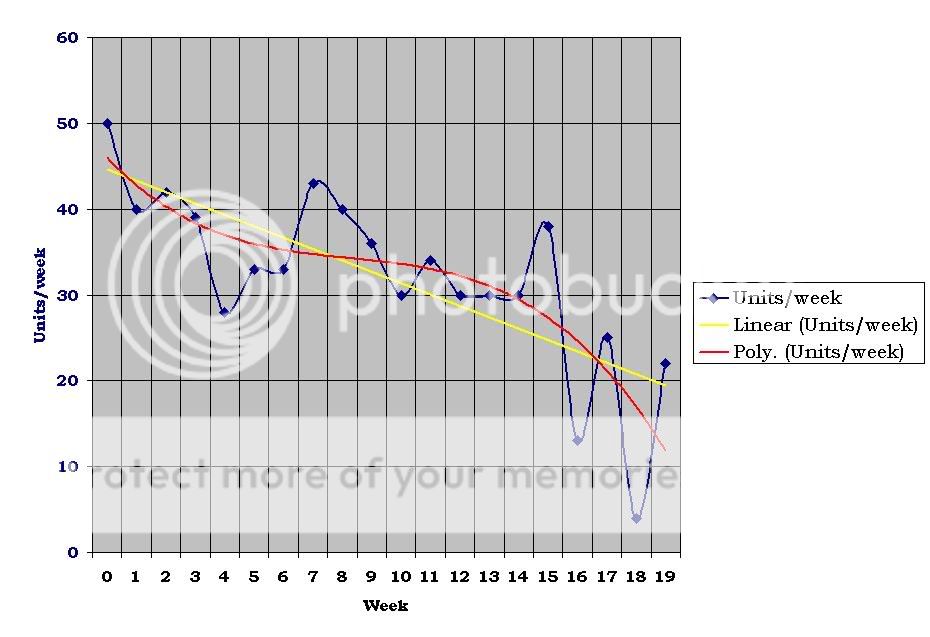
Until I get many weeks more data, an exponential decay curve does not fit my data very well as recorded. Linear doesn't either. I tried several types of curves to match the data well, before settling on the polynomial of the order that I chose. Yes, a polynomial would cross the zero line at some point in the future, and of course that is an impossibility. However, within the boundary conditions it statistically fits better than the alternatives. As an engineer, we often use polynomials to match data sets, but we understand that the polynomial is only valid within the boundary limit of the data set and cannot be used as a predictor. An exponential often can be used as a predictor, however (and this is important), exponential decay curves do not always fit the data well and therefore indicate invalid approximations of the phenomenon.

After all that, I am just displaying here that there is a general downward trend in my drinking, regardless of the type of curve or line that I use. And I am showing to myself and others that progress is being made even though it is not a classic decay curve that would be expected.

Bob

_________________
Code:
Pre-TSM~54u/Wk
Wk1-52:40,42,39,28,33,33,43,40,36,30,34,30,30║30,38,13,25,4,22,12,6,9,5,9,3,5║6,6,5,4,9,6,0,9,2,2,5,4,4║3,4,5,3,4,2,6,2,6,4,8,2,2u
W53-91: 4, 2, 2, 2, 3, 2, 1, 5, 4,17, 0, 0, 0║ 3, 0, 3, 0,3, 0, 2,0,0,0,0,0,0║0,0,0,2,0,2,0,0,3,0,0,2,0u
"Cured" @ Week 21 (5 Months),         Current Week: 97  (23rd Month)


Top
 Profile E-mail  
 
 Post subject: Re: Bob's Weekly Progress
PostPosted: Mon Jul 27, 2009 4:38 pm 
Offline

Joined: Tue Jun 02, 2009 11:14 am
Posts: 317
Plain-vanilla

The purpose of adding 0.001 is that there is no value of x (other than infinity) for which exp(x) is 0. If you have zero values in your data (a dry day, or week) then Excel will fall over when it tries to make an exponential fit. Adding 0.001 units makes no practical difference, but it 'fools' Excel into doing what we want.

Bob - it is poor engineering to do what you're suggesting. Using a polynomial to match the data sets makes no sense unless you have specific information about the nature of the relationship between the variables. What you're describing is effectively 'chi-by-eye' and is little more than guesswork - you have no information between the points, so you might as well guess. You need to have some hypothesis about the nature of the relationship, and then use whatever statistical test (e.g. R^2) to determine how well that hyopthesis fits the data. But without a credible hypothesis, it makes little sense. You appear to have used a 3rd degree polynomial - why not a 4th, or a 5th, or a 6th? They all give even better fits!

You're going about the process backwards - assuming that a curve that 'fits a data set well' infers understanding of the phenomenen - it doesn't!

The mechanism here is what makes an exponential curve the appropriate model (or at least more appropriate) to use. In any case the exponential isn't statistically THAT much worse a fit to your data.

As you say - in any case the trend is downwards, and that is the important issue.

_________________
Pre-TSM, ~105 (UK) Units, ~0.5 AF days, Craving 8
Wk 1-8 93/0.25/3.5
Wk 9-16 79.5/0.5/2.8
Wk 17-24 75/1.2/2.7
Wk 25-32 61.5/2.3/1.6
Wk 33-40 47/3.5/1.1
Wk 41-48 47/3.5/1
Wk 49-56 44/3.8/1
Wk 57-64 45/3.8/1
Wk 66 45/3/1
Wk 66 65/1/1
Wk 67 48/3/1


Top
 Profile E-mail  
 
 Post subject: Re: Bob's Weekly Progress
PostPosted: Mon Jul 27, 2009 5:08 pm 
Offline

Joined: Tue May 19, 2009 2:17 pm
Posts: 1793
I think you guys need to take this outside. :)

But seriously, my GF peeked over my shoulder and asked, "Do you have a cute graph like that?" when I was viewing Bob's thread. That's about my level of appreciation regarding this subject as well. When I first read this thread I thought I had accidentally stumbled into an MIT chat room. :mrgreen:

_________________
Pre-TSM:50+wk/hangovers/blackouts/bad behavior
Regained Control wk36
Now:<20/wk/NO hangovers/blackouts/bad behavior
(Nothing in this post should be construed as medical/legal advice. Always consult a physician before taking prescription drugs.)


Top
 Profile E-mail  
 
 Post subject: Re: Bob's Weekly Progress
PostPosted: Mon Jul 27, 2009 5:40 pm 
Offline

Joined: Tue Jun 02, 2009 11:14 am
Posts: 317
minneapolisnick wrote:
I think you guys need to take this outside. :)

But seriously, my GF peeked over my shoulder and asked, "Do you have a cute graph like that?" when I was viewing Bob's thread. That's about my level of appreciation regarding this subject as well. When I first read this thread I thought I had accidentally stumbled into an MIT chat room. :mrgreen:


:lol: :lol:

http://books.google.com/books?id=1aAOdz ... t&resnum=5

From a book that no engineer or scientist should be without - a brilliant piece of writing and compendium of knowledge. Paragraph three at the top of the page sums up what I've been talking about ;)

_________________
Pre-TSM, ~105 (UK) Units, ~0.5 AF days, Craving 8
Wk 1-8 93/0.25/3.5
Wk 9-16 79.5/0.5/2.8
Wk 17-24 75/1.2/2.7
Wk 25-32 61.5/2.3/1.6
Wk 33-40 47/3.5/1.1
Wk 41-48 47/3.5/1
Wk 49-56 44/3.8/1
Wk 57-64 45/3.8/1
Wk 66 45/3/1
Wk 66 65/1/1
Wk 67 48/3/1


Top
 Profile E-mail  
 
Display posts from previous:  Sort by  
Post new topic Reply to topic  [ 582 posts ]  Go to page Previous  1 ... 30, 31, 32, 33, 34, 35, 36 ... 59  Next

All times are UTC - 6 hours


Who is online

Users browsing this forum: No registered users and 11 guests


You cannot post new topics in this forum
You cannot reply to topics in this forum
You cannot edit your posts in this forum
You cannot delete your posts in this forum

Search for:
Jump to:  
Powered by phpBB © 2000, 2002, 2005, 2007 phpBB Group