Joined: Sun Mar 15, 2009 7:40 pm
Posts: 962
Location: Florida
|
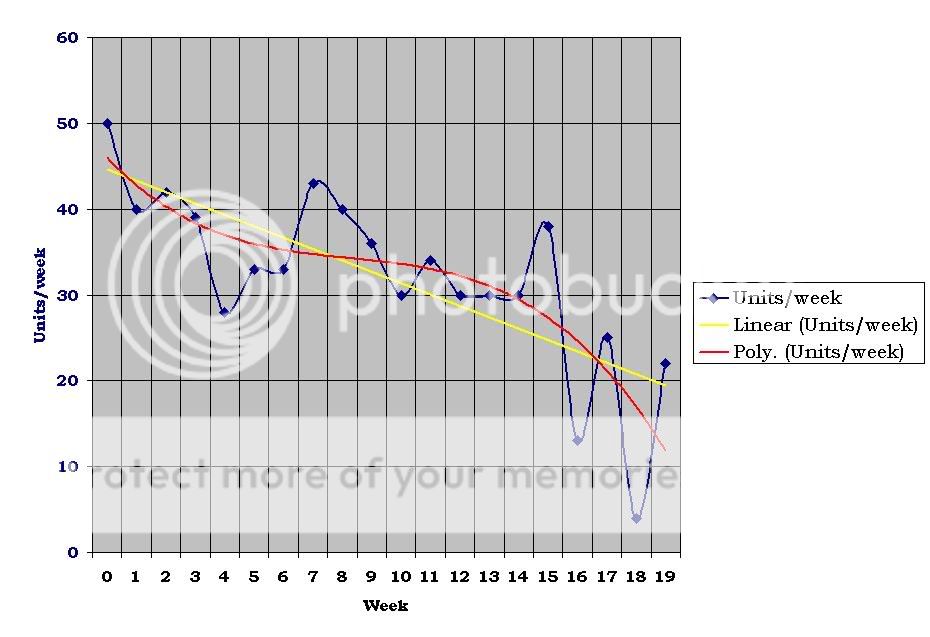
allie wrote: ...Do you mind if I ask what program you used to create your line graph? I have been keeping a detailed drinking log since I started tsm but at this stage in the game I think it would be helpful to track my progress on a linear graph. It might help me focus on the "whole picture" rather than the spikes in my drinking pattern... I use MS Excel 2003. The graphing functions are fairly comprehensive, but sometimes the cool features are well hidden such as the linear average and the polynomial average. If I look just at my numbers, I cannot see a clear trend. It is only when I graph it that the true downward trend is obvious. ~Q~ wrote: The roller coaster ride of TSM is probably the most difficult part of this treatment. It is so easy to get down on yourself during those peaks. You are right there Bob. You had something that needed extinguishing last week, so all you can really do is ride it out and let NAL do its thing... You can't look at this treatment as being successful or not on any single particular day. It's like figuring out the climate of a location by picking a single day and looking at the weather for that day. It is only when you look at it for a number of days or weeks or even months can you truly see the big picture. Yes, last week must have had some new daily trigger that needed extinguishing. Then when I felt under the weather those 2 days, I stopped drinking altogether and haven't had a desire since then. I guess the Naltrexone accomplished its extinguishing for that trigger. I have a different week this week, so we'll see how it goes. Bob
_________________
Code: Pre-TSM~54u/Wk
Wk1-52:40,42,39,28,33,33,43,40,36,30,34,30,30║30,38,13,25,4,22,12,6,9,5,9,3,5║6,6,5,4,9,6,0,9,2,2,5,4,4║3,4,5,3,4,2,6,2,6,4,8,2,2u
W53-91: 4, 2, 2, 2, 3, 2, 1, 5, 4,17, 0, 0, 0║ 3, 0, 3, 0,3, 0, 2,0,0,0,0,0,0║0,0,0,2,0,2,0,0,3,0,0,2,0u
"Cured" @ Week 21 (5 Months), Current Week: 97 (23rd Month)
|
|