Joined: Sun Mar 15, 2009 7:40 pm
Posts: 962
Location: Florida
|
Yes, I see. An R² correlation coefficient of below 2 is essentially saying no correlation. However, the thread that you referred to afterward begins by showing my initial progress and then my progress through my initial extinction. My correlation to an exponential decay curve, pre-extinction was dismal. Post-extinction, the curve becomes more and more correlated with an exponential decay curve. Mine will never be perfect, nor will yours be, because of that hump that exists post-honeymoon effect. And your hump is much more pronounced than mine was. (That sentence doesn't sound good out of context). I did a monthly graph of your numbers thus far: 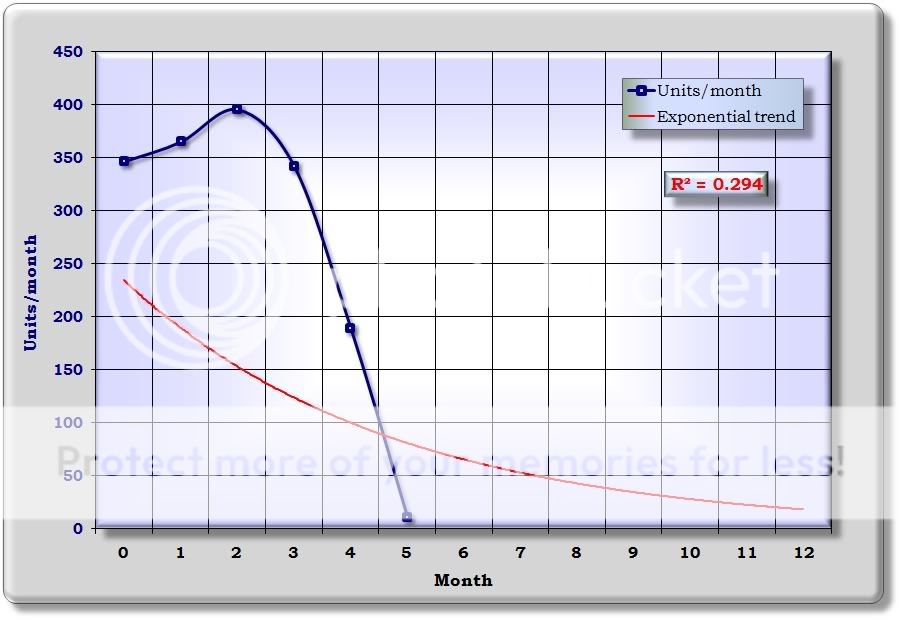 Still, a poor correlation, even if I estimate numbers into your future months it'll never be a good correlation to an exponential decay. Of course you are still in the early days of extinction, so who knows what the numbers will actually be. Bob
_________________
Code: Pre-TSM~54u/Wk
Wk1-52:40,42,39,28,33,33,43,40,36,30,34,30,30║30,38,13,25,4,22,12,6,9,5,9,3,5║6,6,5,4,9,6,0,9,2,2,5,4,4║3,4,5,3,4,2,6,2,6,4,8,2,2u
W53-91: 4, 2, 2, 2, 3, 2, 1, 5, 4,17, 0, 0, 0║ 3, 0, 3, 0,3, 0, 2,0,0,0,0,0,0║0,0,0,2,0,2,0,0,3,0,0,2,0u
"Cured" @ Week 21 (5 Months), Current Week: 97 (23rd Month)
|
|


